Examples
LinkedIn Ads: 95,895 Real Ad Creatives from 636 B2B Advertisers
This is what B2B companies are actually running on LinkedIn. AdPeekly tracks 253,610 published ads from 636 advertisers, deduplicated down to 95,895 distinct creatives, with first-seen and last-seen dates recorded for each, and an end date for the ones that have stopped. Below: forty of them, the real format mix, and how long campaigns run.
Most collections of LinkedIn ads examples are a writer's screenshots from one afternoon, which tells you what caught one person's eye and nothing about what the market does. These numbers come from the whole corpus instead. Counts are per distinct creative, not per ad, so the same design running in eight variants counts once: that distinction is why the headline says 95,895 and not 253,610. Observation window 2026-06-10 to 2026-09-22.
Forty real LinkedIn ad examples
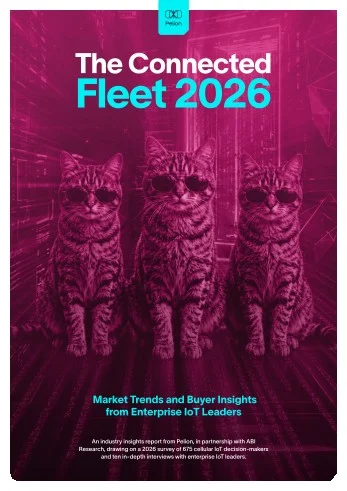
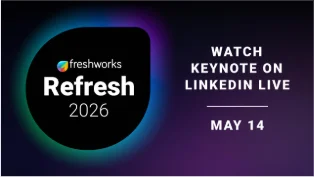
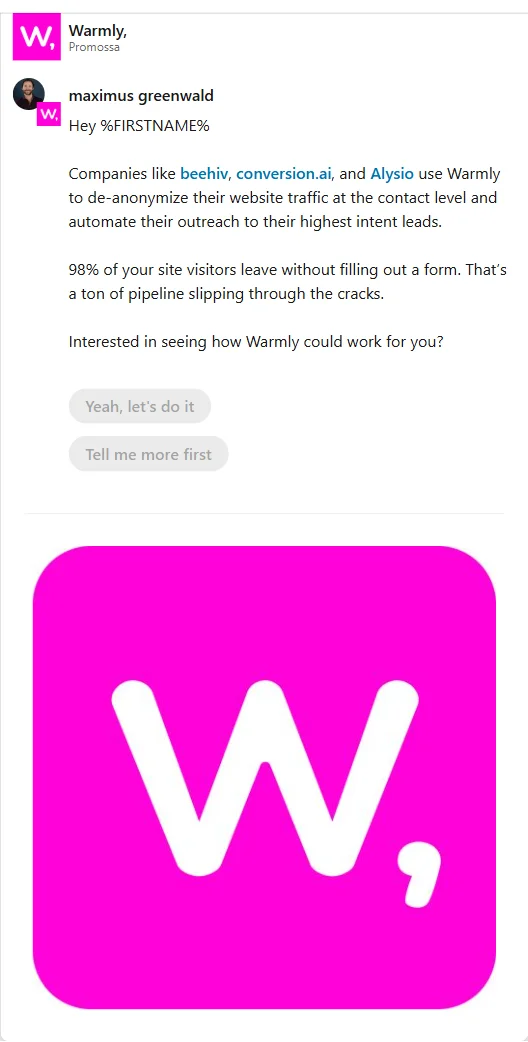
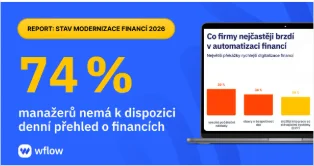
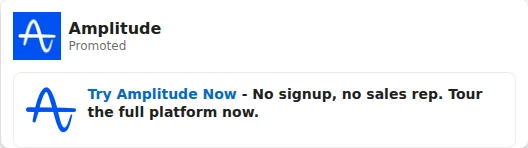
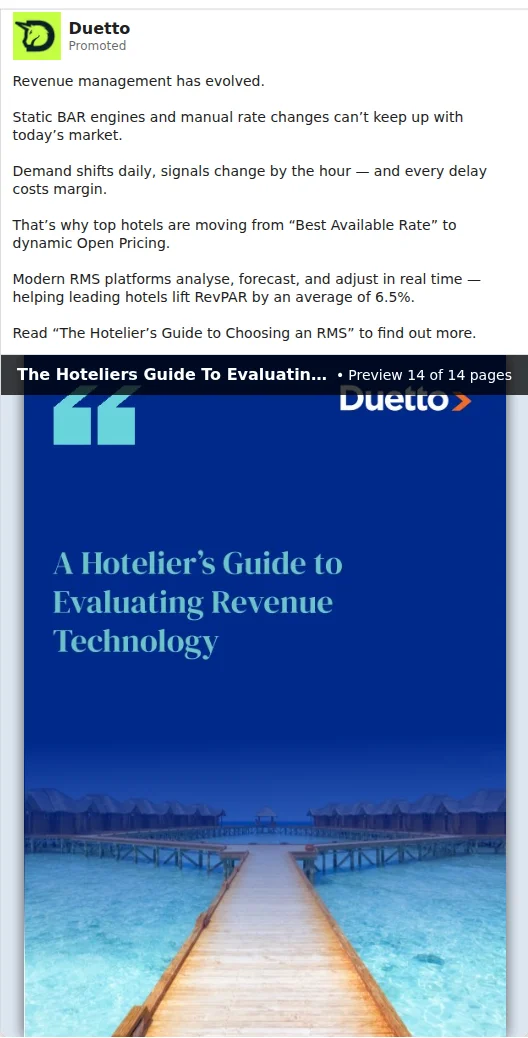
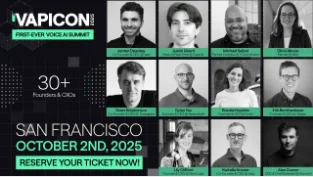
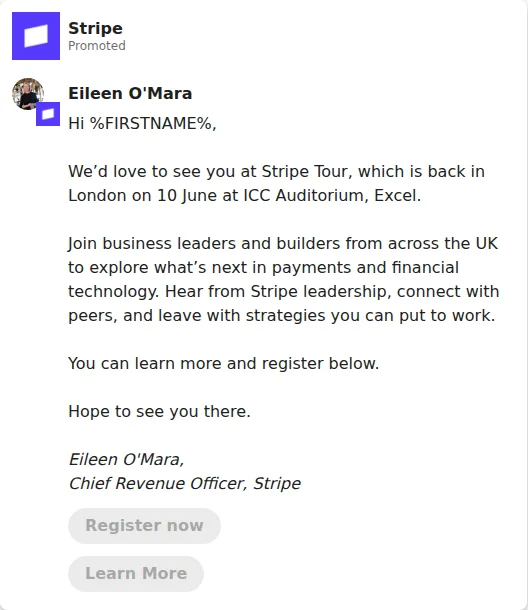
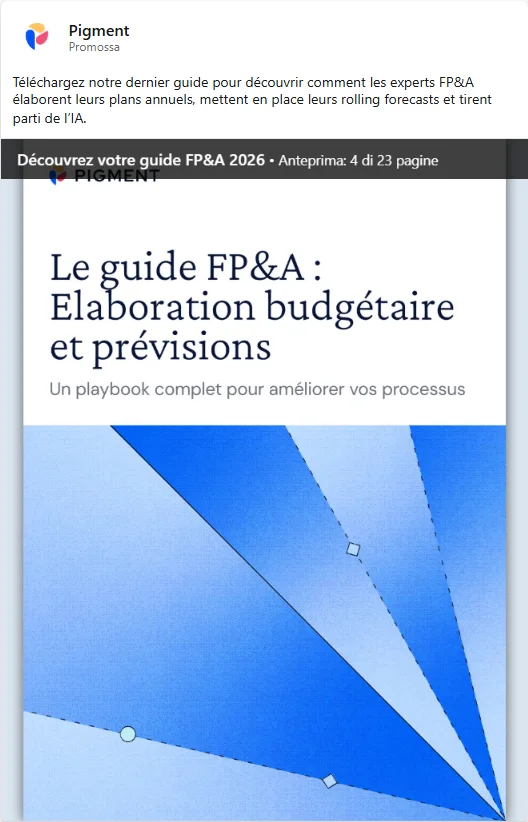
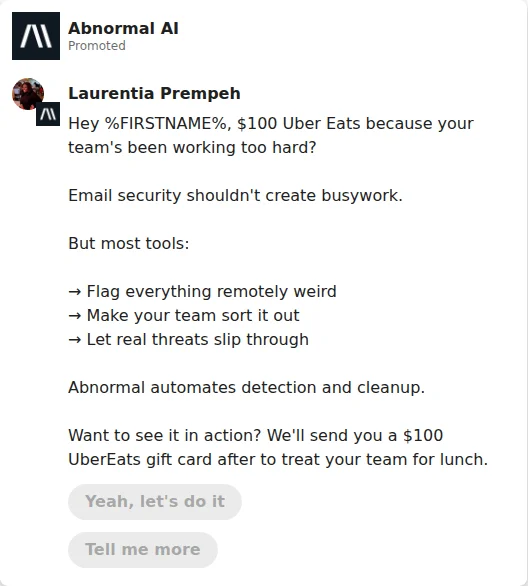
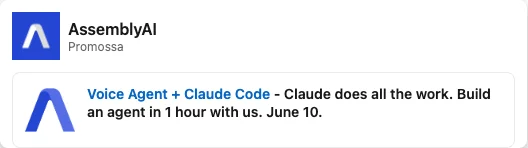
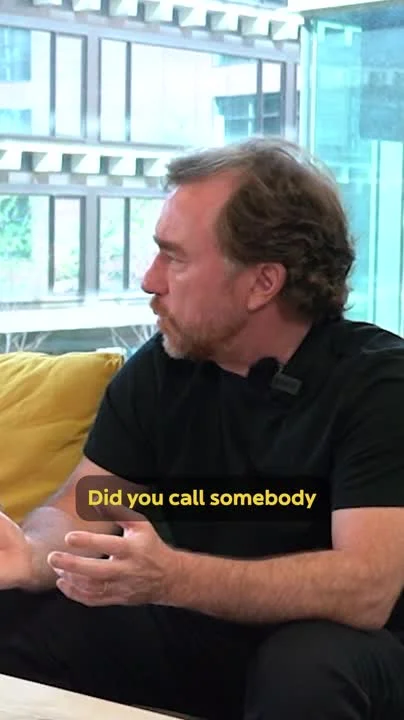
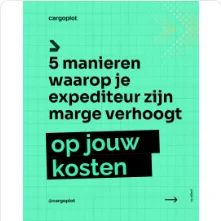
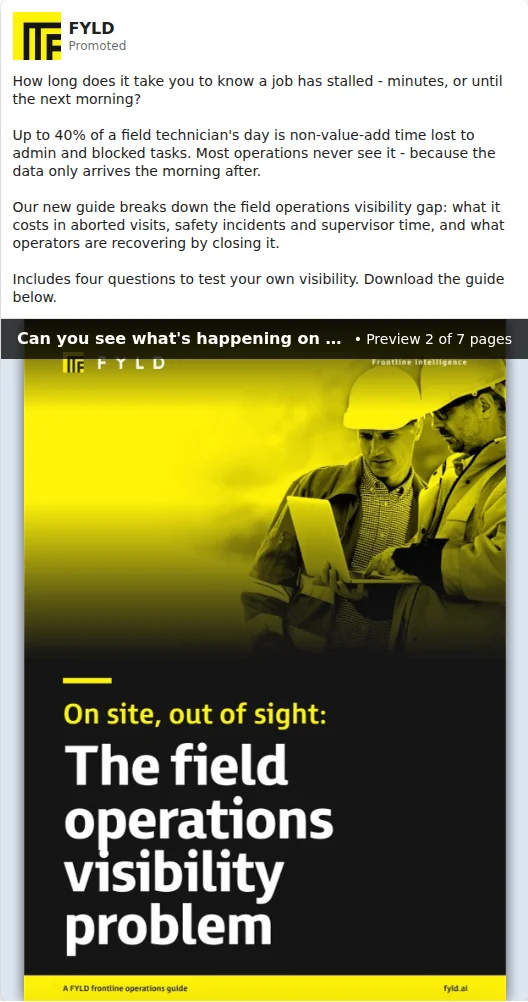
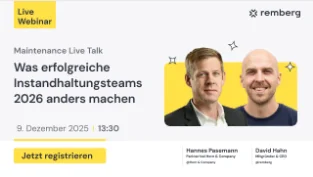
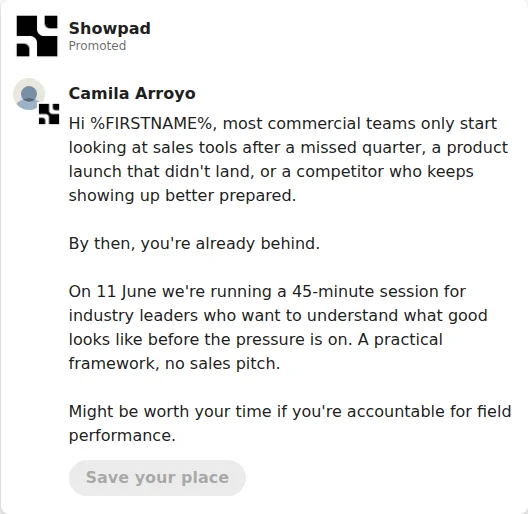
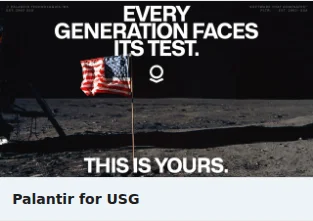
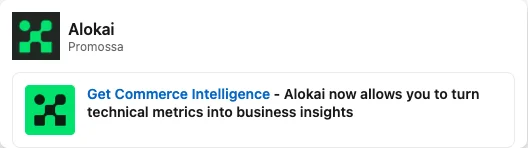
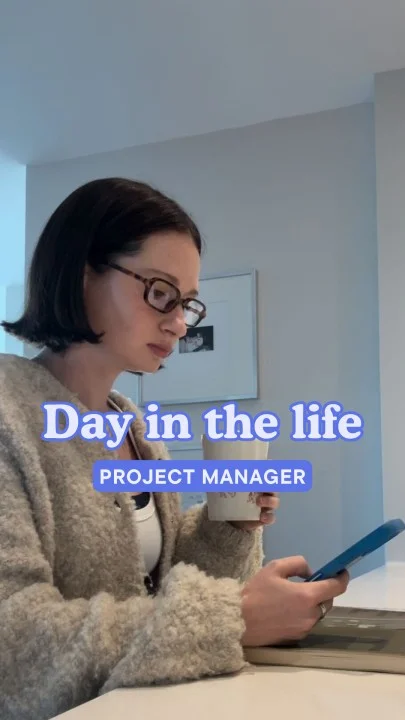
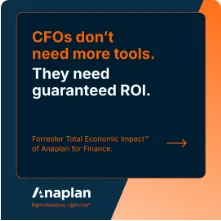
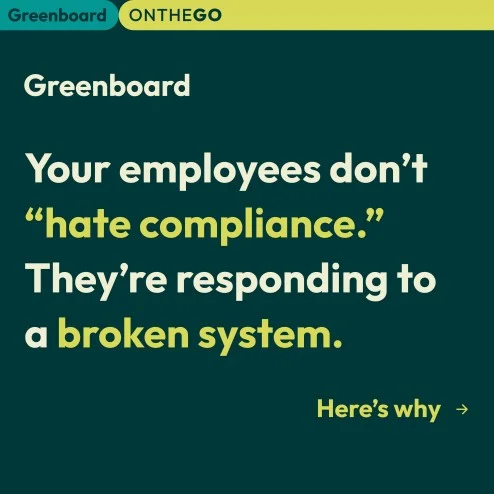
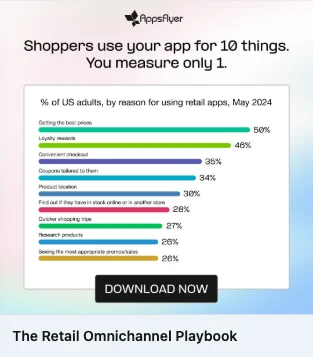
One creative per company and a deliberate spread across all 7 formats, so every format is actually visible. That balance is a display choice, not the market: the real mix is in the table below, and it is far more lopsided than this grid looks. Two other filters apply, both for page weight rather than for merit: creatives wider than 600 pixels or heavier than 60 KB are skipped. Selection is otherwise deterministic, so this set does not reshuffle between updates.



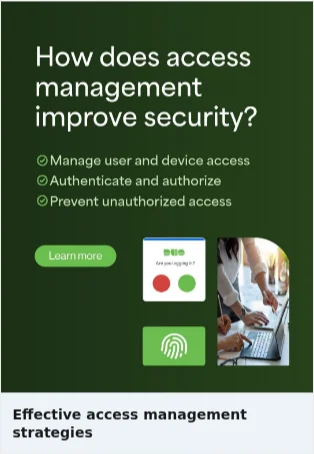
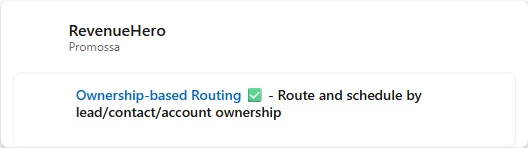
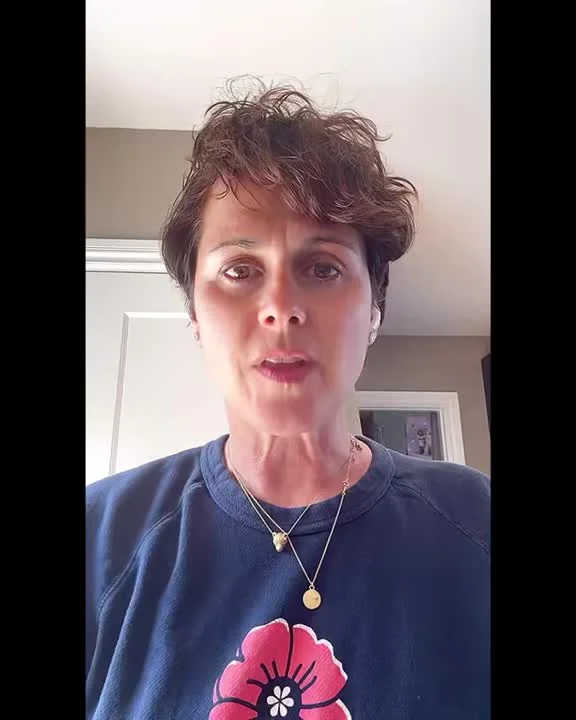


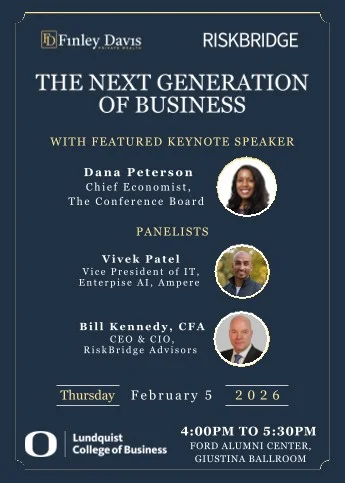

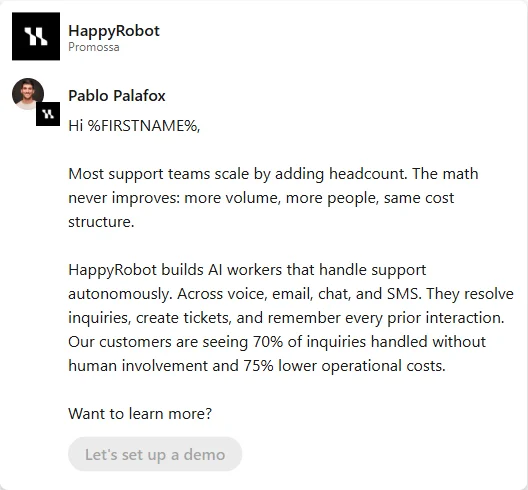

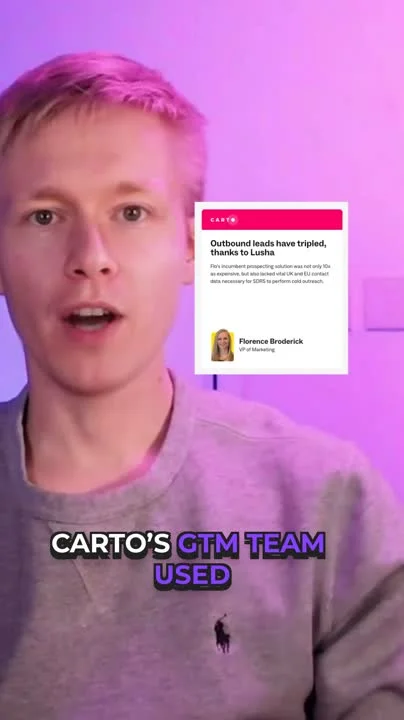



The real format mix, measured
More than two thirds of B2B LinkedIn advertising is a single static image. Across the 253,610 published ads AdPeekly tracks, single-image ads are 67.93% and carousel ads, which nearly every guide to LinkedIn ad types gives a section of its own, are 1.96%. Every article on this subject lists the seven formats LinkedIn sells. This is what advertisers actually ship.
| Format | Ads | Creatives | Share of ads |
|---|---|---|---|
| Single Image Ad | 172,267 | 61,710 | 67.93% |
| Video Ad | 45,993 | 17,341 | 18.14% |
| Document Ad | 14,249 | 6,280 | 5.62% |
| Message Ad | 12,348 | 6,015 | 4.87% |
| Carousel Ad | 4,982 | 2,174 | 1.96% |
| Unclassified | 1,584 | 1,018 | 0.62% |
| Text Ad | 1,307 | 754 | 0.52% |
| Event Ad | 880 | 603 | 0.35% |
The unclassified row is carried rather than dropped: without it the shares would not sum, and a reader checking that is exactly the reader this page is written for.
Campaign length barely moves with format, which is the second surprise in this data. Across the 38,729 creatives where LinkedIn reported a campaign start date, the median B2B LinkedIn campaign runs 19 days, and the spread between the shortest and longest format is 7 days: message ads sit at 16 days against carousel ads at 23. Medians are published only for formats with at least 500 dated creatives from five or more advertisers, which is why text and event ads are absent here: their samples are too thin to say anything honest with.
One qualifier on that median, because it cuts the other way from the one people expect. Roughly 6% of those campaigns were still running when they were last checked, so their measured length is a floor rather than a final number. That pushes the 19-day figure slightly up, not down: the true median is a little shorter, not longer.
Go deeper
The same data, cut by vertical: each page carries its own creative count, format mix and median campaign duration measured against the 19-day dataset median above.
How this was counted
Two rules do most of the work here, and both cut against making the numbers look bigger. Creative counts collapse template variants, so one design running in eight sizes counts once; that is the difference between 253,610 ads and 95,895 creatives, and quoting the first where the second belongs is how ad galleries usually inflate themselves. Durations use only campaigns where LinkedIn published a start date, because for the rest the only measurable span is how long AdPeekly has been watching, which says nothing about the advertiser.
The coverage limit matters too: this is 636 B2B companies on a curated list, not every LinkedIn advertiser. It is a wide sample of B2B software and services, and it is not a census. The methodology page spells out the collection cadence, the deduplication rule and the known biases.
What surprised me most, rebuilding these numbers, was how little the formats differ once you look at duration. The industry argues about carousel versus video as though the choice changes the campaign, and in this dataset it changes it by about four days. The variation that matters is somewhere else.
Data compiled by Daniele Viero, founder of AdPeekly. Figures on this page last verified 2026-09-22, over an observation window of 2026-06-10 to 2026-09-22.
Common questions about LinkedIn ads
Most of them look like an ordinary post with a small "Promoted" label: one static image, a headline under it and a button. Across the 253,610 published ads in AdPeekly's dataset, 67.93% are exactly that single-image format. The rest are video, multi-page documents that readers swipe through in the feed, sponsored InMail messages, carousels, plain text units in the right rail, and event promotions. The visual language is narrower than most guides suggest: B2B advertisers overwhelmingly ship one image and one sentence, and the ads that stand out tend to do it with the claim rather than with the format.
LinkedIn sells seven ad formats: single image, video, document, message, carousel, text and event. Every guide lists all seven as though advertisers pick between them evenly. The published data says otherwise: single image is 67.93% of 253,610 ads and carousel, which usually gets a section of its own in those guides, is 1.96%. If you are deciding what to build, the honest summary is that you are choosing between a static image and a video most of the time.
The median B2B LinkedIn campaign runs 19 days, measured across the 38,729 creatives where LinkedIn reported a campaign start date. Ad format barely changes it: the shortest and longest format medians sit within a few days of each other. About 6% of those campaigns were still running when they were last checked, so their measured length is a floor rather than a final figure, which nudges the median slightly up rather than down.
AdPeekly cannot answer that from spend or conversion data, which no public source has, and will not pretend otherwise. What the dataset does show is sustained presence: 636 B2B companies were still running ads at the end of the observation window, and the median campaign runs 19 days across 38,729 dated creatives. That is evidence about what the market keeps doing, not evidence that it works, and certainly not a forecast for your account.
LinkedIn's own Ad Library shows every ad an advertiser is running right now, free and without an account, one company at a time. Its limit is the words "right now": when a campaign stops, its ads disappear and no history remains. That is why AdPeekly exists, and the practical differences between the two are worth understanding before you rely on either one.
The full comparison between LinkedIn's own tool and a kept archive is on the LinkedIn Ad Library guide.
Look through all 95,895 creatives
Forty ads is a sample. The full library is searchable by company, format and campaign duration, with the first-seen and last-seen dates on every creative.
Start free